This chart from the NIC Q3 2020 NIC MAP Market Fundamentals is a SHOCKER:
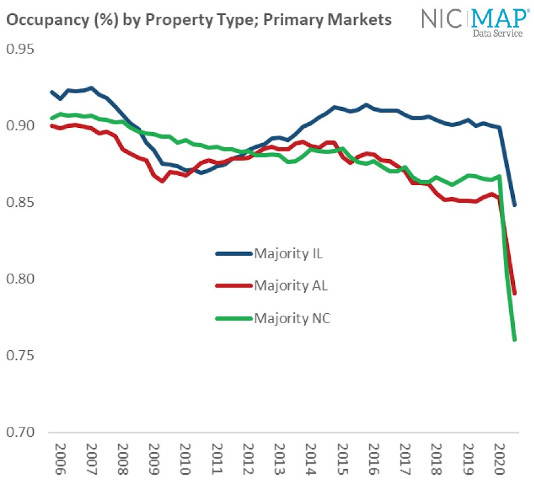
This most recent occupancy level for the Primary Markets is the lowest NIC has ever recorded since they started tracking occupancy in 2006.
The Raw Numbers
- Overall occupancy (all product types) 82.1%
- Majority IL 84.9%
- Majority AL 79.1%
- Majority Nursing Care 76.0%
Other Warning Signs
- Annual asking rent growth has dropped to 1.7% (and rarely is asking rent what is being paid)
- Annual Absorption is a negative 3.8%
Pulling Back The Covers
We know the average occupancy rate is just that: it is an average. And there is some distribution around that average. This means some communities, even in the time of COVID-19 have occupancy levels that are higher than 90% and 95%. It also means there are communities that are way below the average. I asked Beth Mace to break this down for me.
Greater than 90% occupancy
Here is how it stacks up for the last 3 quarters:
- In Q1 54% of properties had occupancies over 90% and 33% had over 95%
- In Q2 43% were over 90% and 22% over 95%
- In Q3 34% were over 90% and 15% over 95%
80% or Lower Occupancy
It is also worth looking at what the under 80% group looks like for 2020.
- The Q1 data shows just 22% of properties had occupancy less than 80%
- In Q2, 29% were under 80% occupancy
- And in Q3, 36% under 80% occupancy
For-Profit vs. Not-for-Profit
There is also a difference between For-Profit and Not-For-Profit organizations with NFPs having an average occupancy of 88.2% vs. 79.4% on the FP side. This likely has to do with the types of senior living communities and how the respective organizations operate as much as anything else.
The Big Question That Didn’t Get Answered
I am particularly interested in those communities that are at occupancies above 90%. I want to know if there was a correlation to operators, or quality of buildings, or geography. That is data that is not available.
What It Means
My reflections:
The scary part is that with the holidays upon us, combined with rapidly deteriorating COVID numbers, the decline seems likely to continue at least through the 4th quarter. During the recently concluded SMASH conference, there was a lot of concern about the impact on families and prospective residents related to isolation restrictions for residents moving into a community or leaving and then coming back.
The good news is that we will likely see some occupancy gains in the new year.
The hopeful part is that we are nearly universally seeing the capital providers working with operators. Something that serves residents, team members, and families well.
The New Normal
It is clear that we are in a “new normal” game. Though it is less clear if this has been accepted by most operators. What will senior living look like if we stay this way for another year or two years or even more?